Evaluation of NFL Pass Rushes Using Tracking Data
This project was my submission to the 2023 NFL Big Data Bowl. The Kaggle page to my submission is here. The contents of this are copied from the Kaggle submission.
Introduction
A “pressure” is defined as a play where a pass rusher records a hurry, hit, or sack. While the three plays are different by definition, they are all positive actions for the defense.
On average, 11.6% of pass rushes result in a pressure. In other words, an average defender might record a pressure on roughly 12% of their pass rush snaps.
What about the other 88% of those pass rushes, though? We know what didn’t happen on those plays (a hurry, hit, or sack), but what about what did happen?
In this project, I fill that void by analyzing every pass rusher’s position on every frame of every dropback. I train a neural network to predict the probability that a pass rusher records a pressure on a play based on relative location and speed features. The use of this model allows for a robust evaluation of pass rushers along with insight on offensive players (both pass blockers and quarterbacks).
Model
Preparation
The task is to train a logistic regression model that predicts the probability that a pass rusher will record a pressure on a given play based on player tracking data at one frame.
The framework for the model used in this project was inspired by Gordeev & Singer’s submission to the 2020 NFL Big Data Bowl. In that iteration of the competition, the task given to participants was to develop a model for predicting how many rushing yards a player would gain after handoff. Their winning submission featured a convolutional neural network with feature vectors based on the relative location and speed of the rusher, 10 offensive players, and 11 defensive players.
After experimentation with other types of models, I found that the CNN approach of Gordeev & Singer seemed to be optimal for the task of estimating pressure probability. In this case, however, it is not necessary to consider all 22 players. Rather than calculating features which incorporated every player on the field, I unsurprisingly found that only three select types of players were important:
- Pass rusher (1)
- Pass blockers (5 to 9)
- Quarterback (1)
There is one pass rusher (the one for which pressure probability is calculated), one quarterback who serves as the target of the pass rush, and at least five blockers who want to prevent the pass rusher from reaching the quarterback. Along with the players who are running routes or in coverage, the other pass rushers are not considered.
As did Gordeev & Singer, I found that relative location and speed features were the most significant predictors. Thus, the final model utilized the following features:
- Pass rusher speed in x and y directions: \((S_x,S_y)_R\)
- Quarterback location relative to pass rusher: \((x,y)R−(x,y)_Q\)
- Quarterback speed relative to pass rusher: \((S_x,S_y)R−(S_x,S_y)_Q\)
- Pass blocker location relative to pass rusher: \((x,y)R−(x,y)_P\)
- Pass blocker speed relative to pass rusher: \((S_x,S_y)R−(S_x,S_y)_P\)
Voronoi features, play-level situational variables (down, yards to go), relative acceleration values, and other candidate features failed to exhibit significant predictive power and were not included.
Neural Network
At each frame of a dropback, I constructed exactly \(R\) input tensors with shape \((9,1,10)\) where \(R=\text{number of pass rushers}\). Each of the nine rows corresponded to a pass blocker while the ten columns corresponded to one of the aforementioned features in the x and y axes (calculated using direction of motion). If there were less than nine pass blockers (the maximum number of pass blockers recorded on a play), extra rows were padded as necessary to ensure a shape of \((9,1,10)\). Due to the first three feature vectors not actually involving pass blockers, the first six columns of each tensor are constant.
The neural network itself has a fairly simple architecture to prevent overfitting - it consists of three convolution layers with a kernel size of one (order invariant) followed by batch normalization and dropout layers respectively. The use of dropout layers proved to be useful in preventing the network from overfitting to the training data set.
The model was fit using the Adam optimizer with a learning rate of 0.001. I used binary cross entropy (or log loss) as the loss function.
Performance
The model was trained on data from Week 1 to Week 4 of the 2021 NFL season. Week 5 & 6 data was used for validation, while Week 7 & 8 data served as the test set.
The model was fit using the Adam optimizer with a learning rate of 0.001. I used binary cross entropy (or log loss) as the loss function.
Predictions on the test set were evaluated with log loss, AUC, and Brier score. I calculated a log loss of 0.319, AUC of 0.783, and Brier score of 0.092. Given a log loss of 0.3310 on the training set, there are not concerns for overfitting.
Analysis
Using the trained model, I calculated the pressure probability for every pass rusher over all frames. All later analysis is done using these modeled values.
Player Analysis
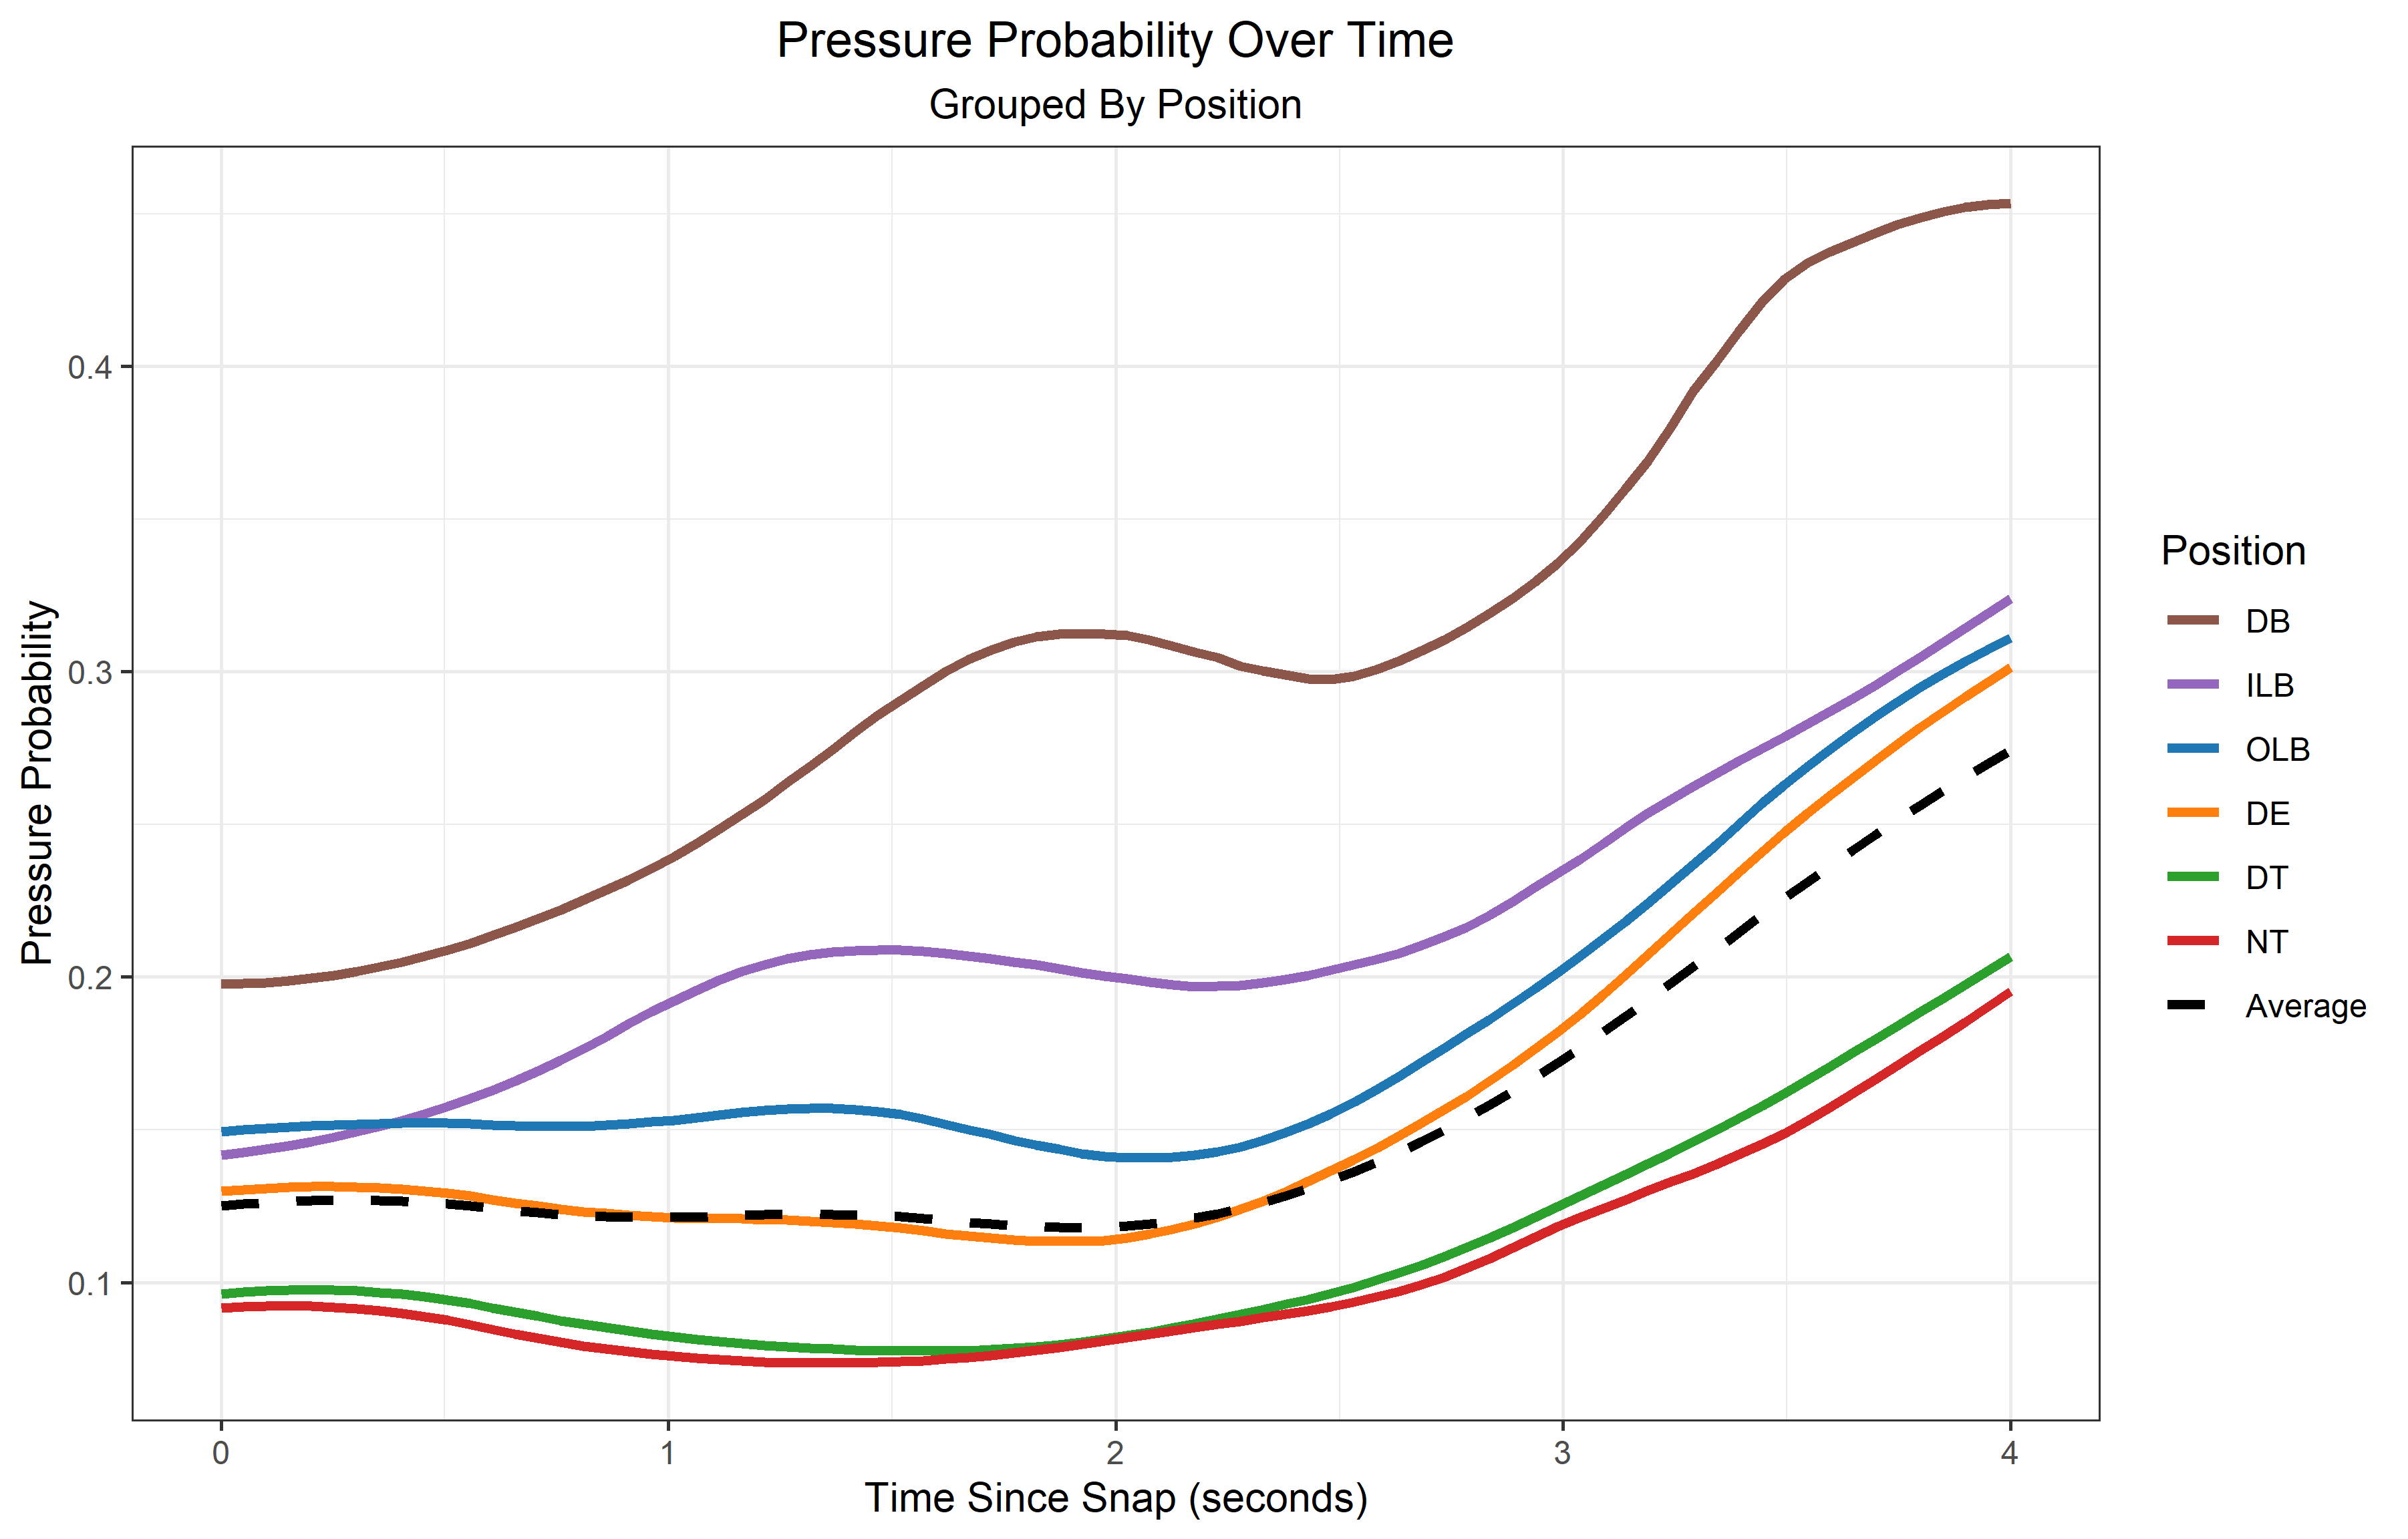
The locally estimated pressure probability for each pass rusher can be calculated and compared to the league average. Consider the following prominent edge rushers.
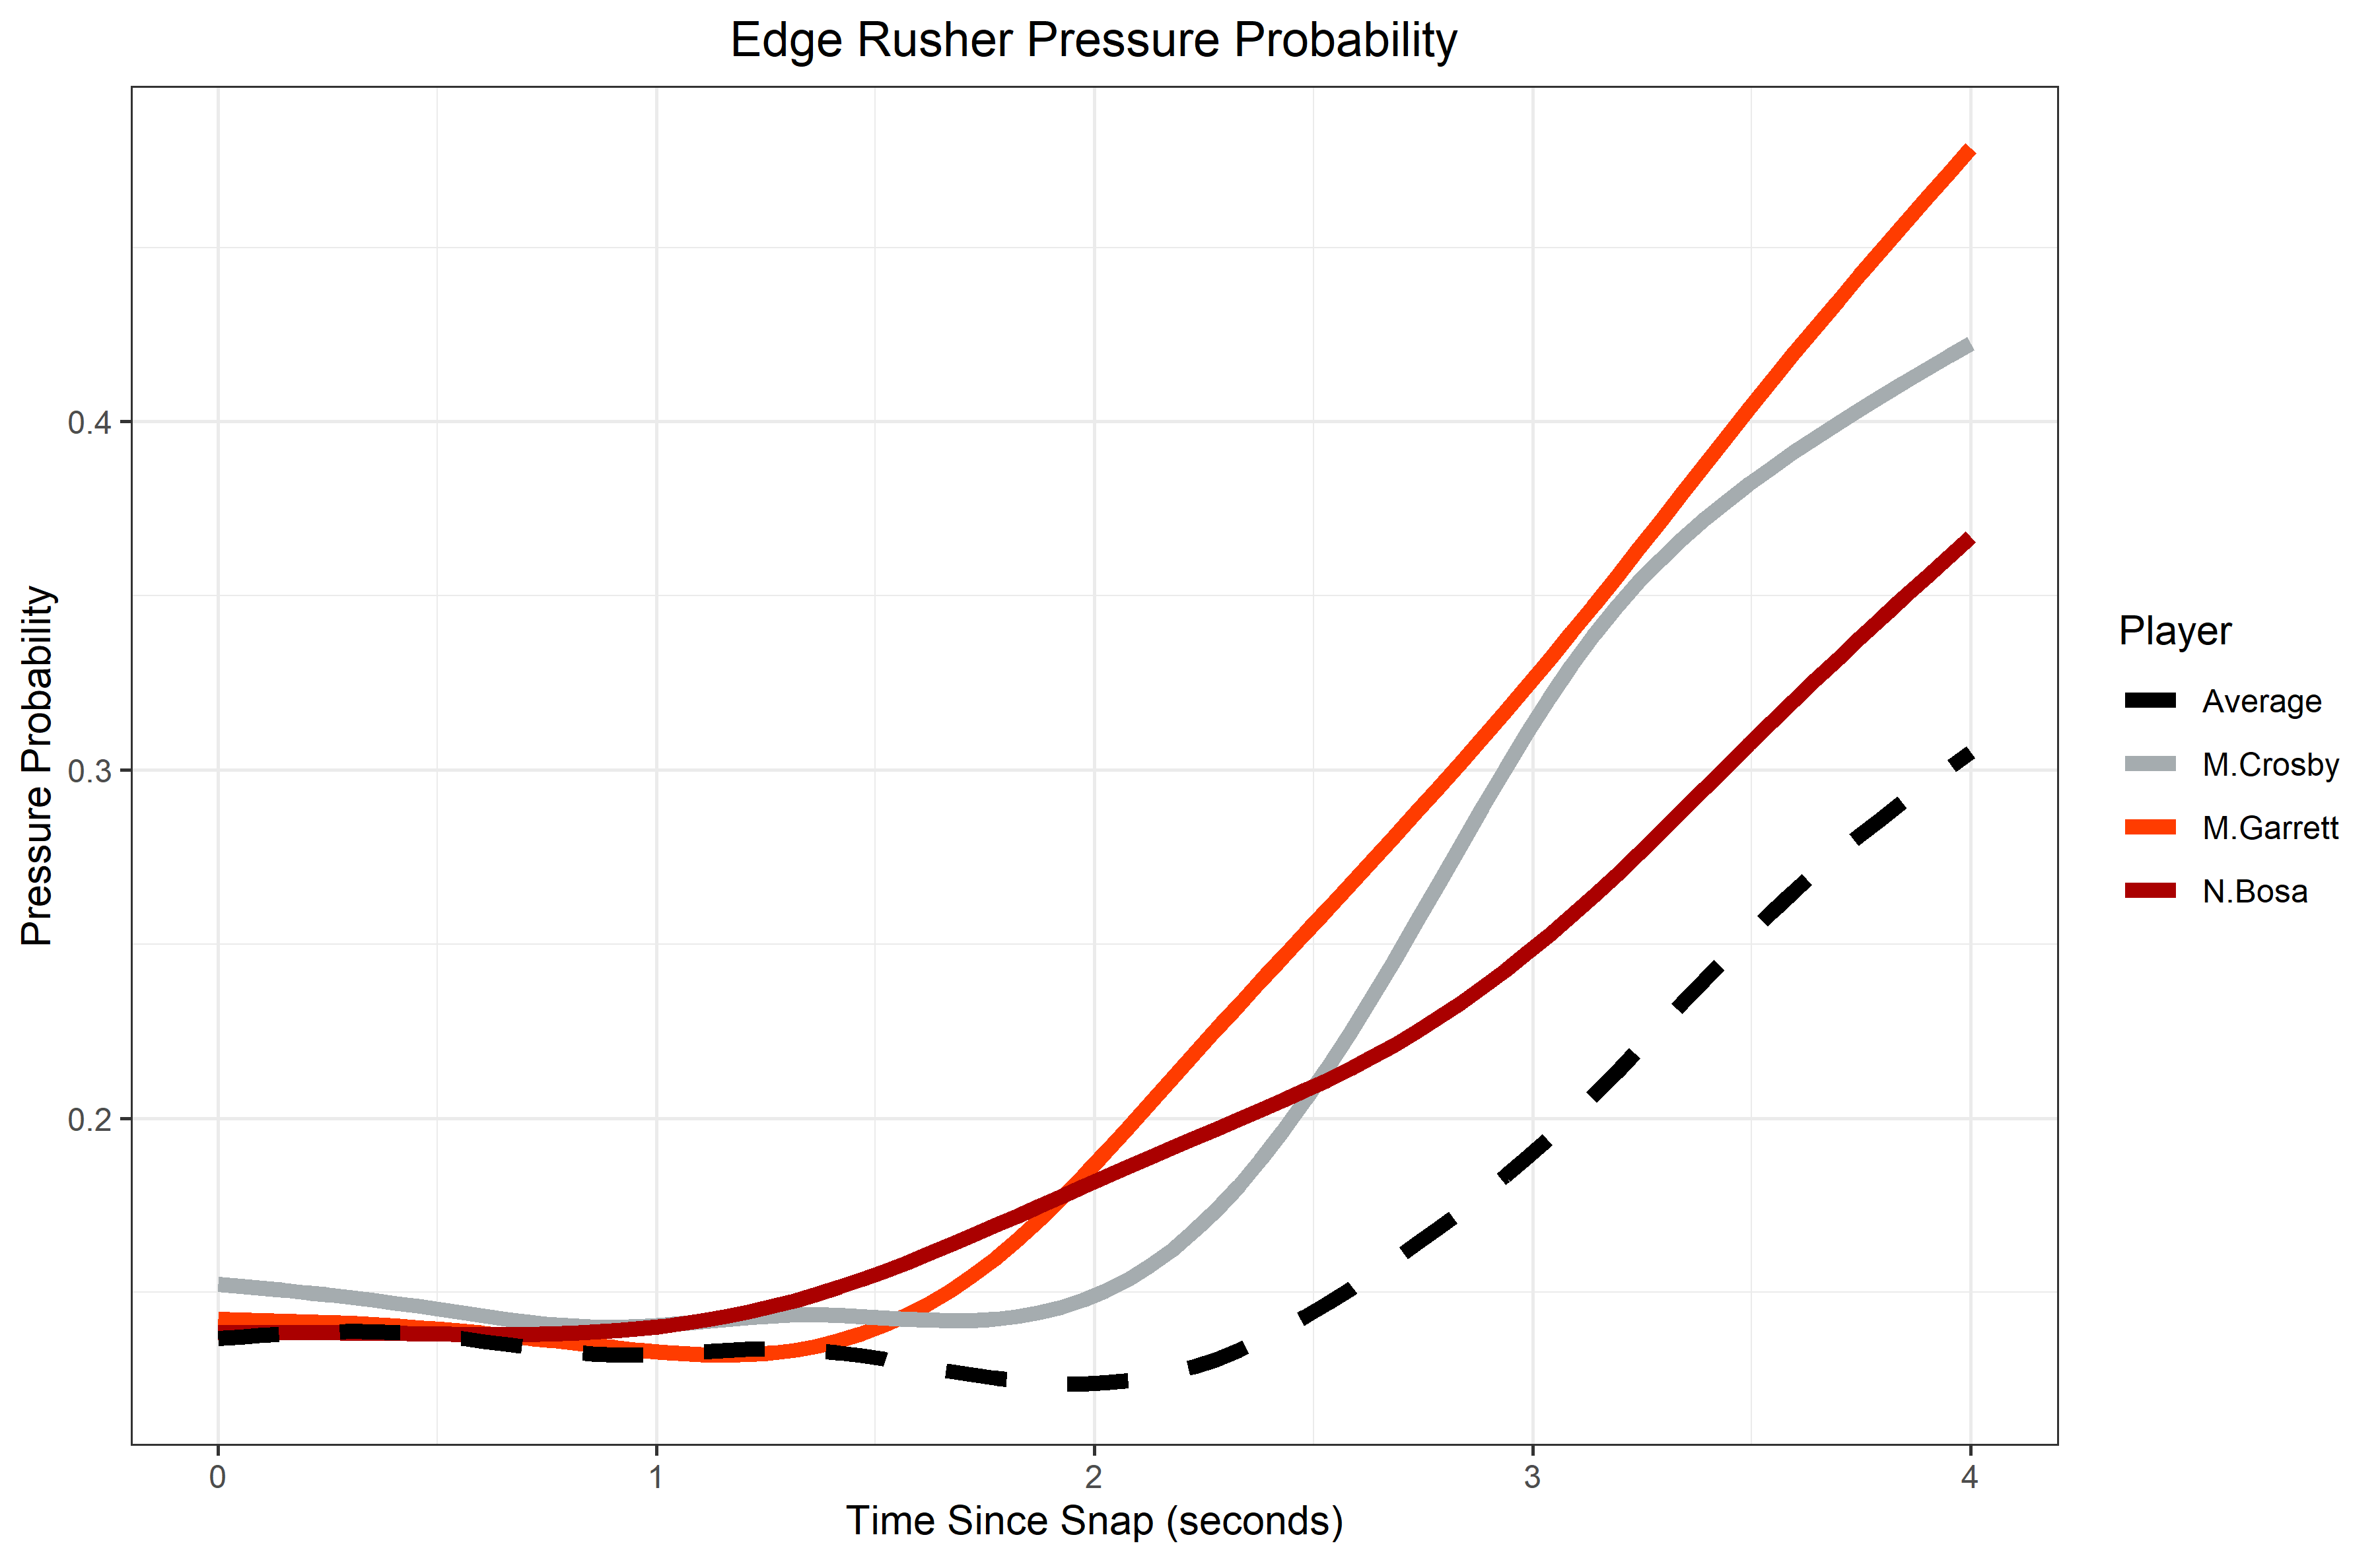
Through this visualization, we can see how the threat of facing a player like Myles Garrett differs from the average edge rusher. While it takes the average player two seconds into a play in order for them to make their presence known, Garrett’s pressure probability starts rising dramatically half a second earlier. On the other hand, it’s the steepness of Maxx Crosby’s curve between the two and three second marks that is truly extraordinary.
The same analysis can be done for pass blockers. Consider the following visualization of the allowed pressure probability for some select offensive linemen.
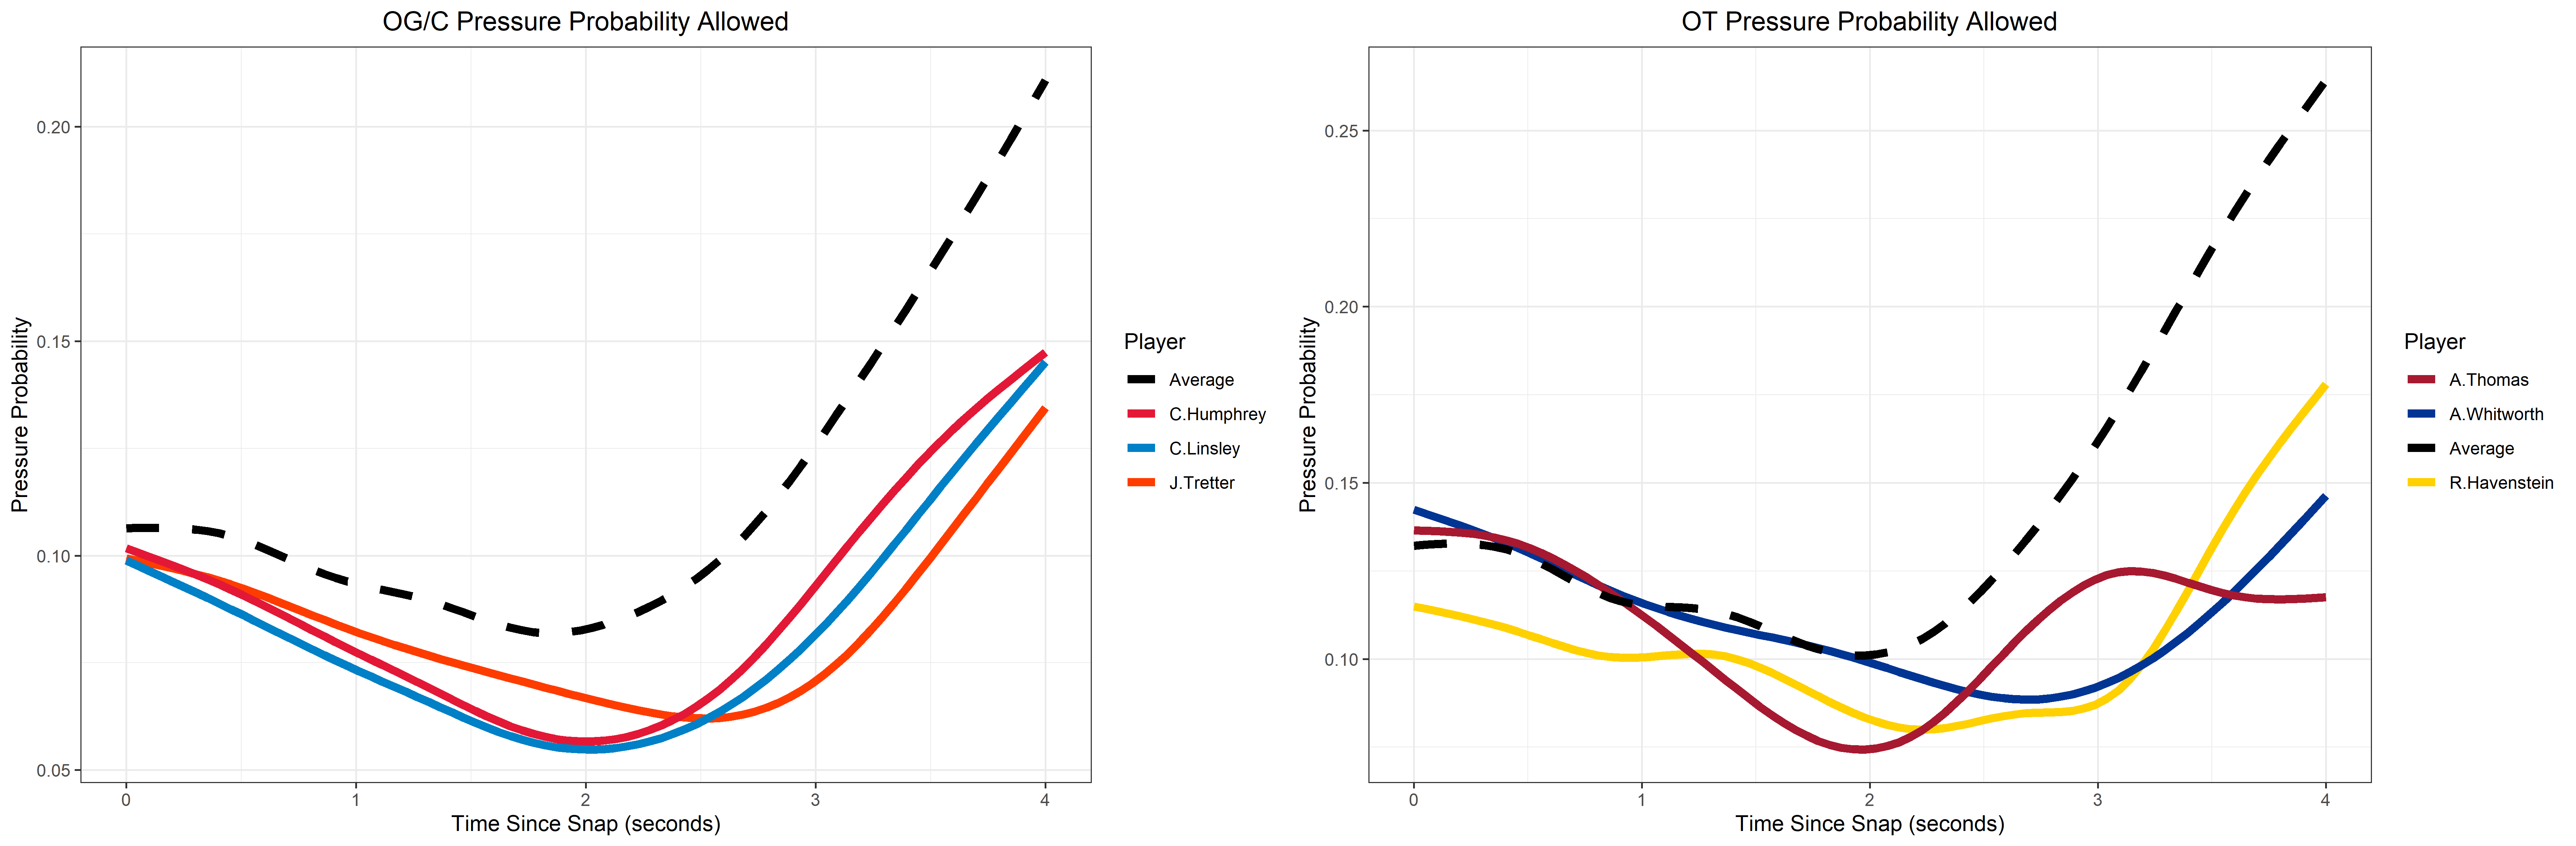
Top centers like Humphrey, Linsley, and Tretter consistently below average allowed pressure probabilities throughout the first four seconds of a play. Their dominance within the first two seconds is particularly daunting - at the two second mark, Linsley and Humphrey boasted towering advantages over their matchup.
Meanwhile, the average edge rusher Andrew Thomas faced accomplished nothing through four seconds. His maximum locally estimated pressure probability allowed is at the start of the play - that’s absurd.
Team Analysis
A simple team pass protection / pass rush evaluation can be conducted by calculating the mean pressure probability on both sides of the ball.
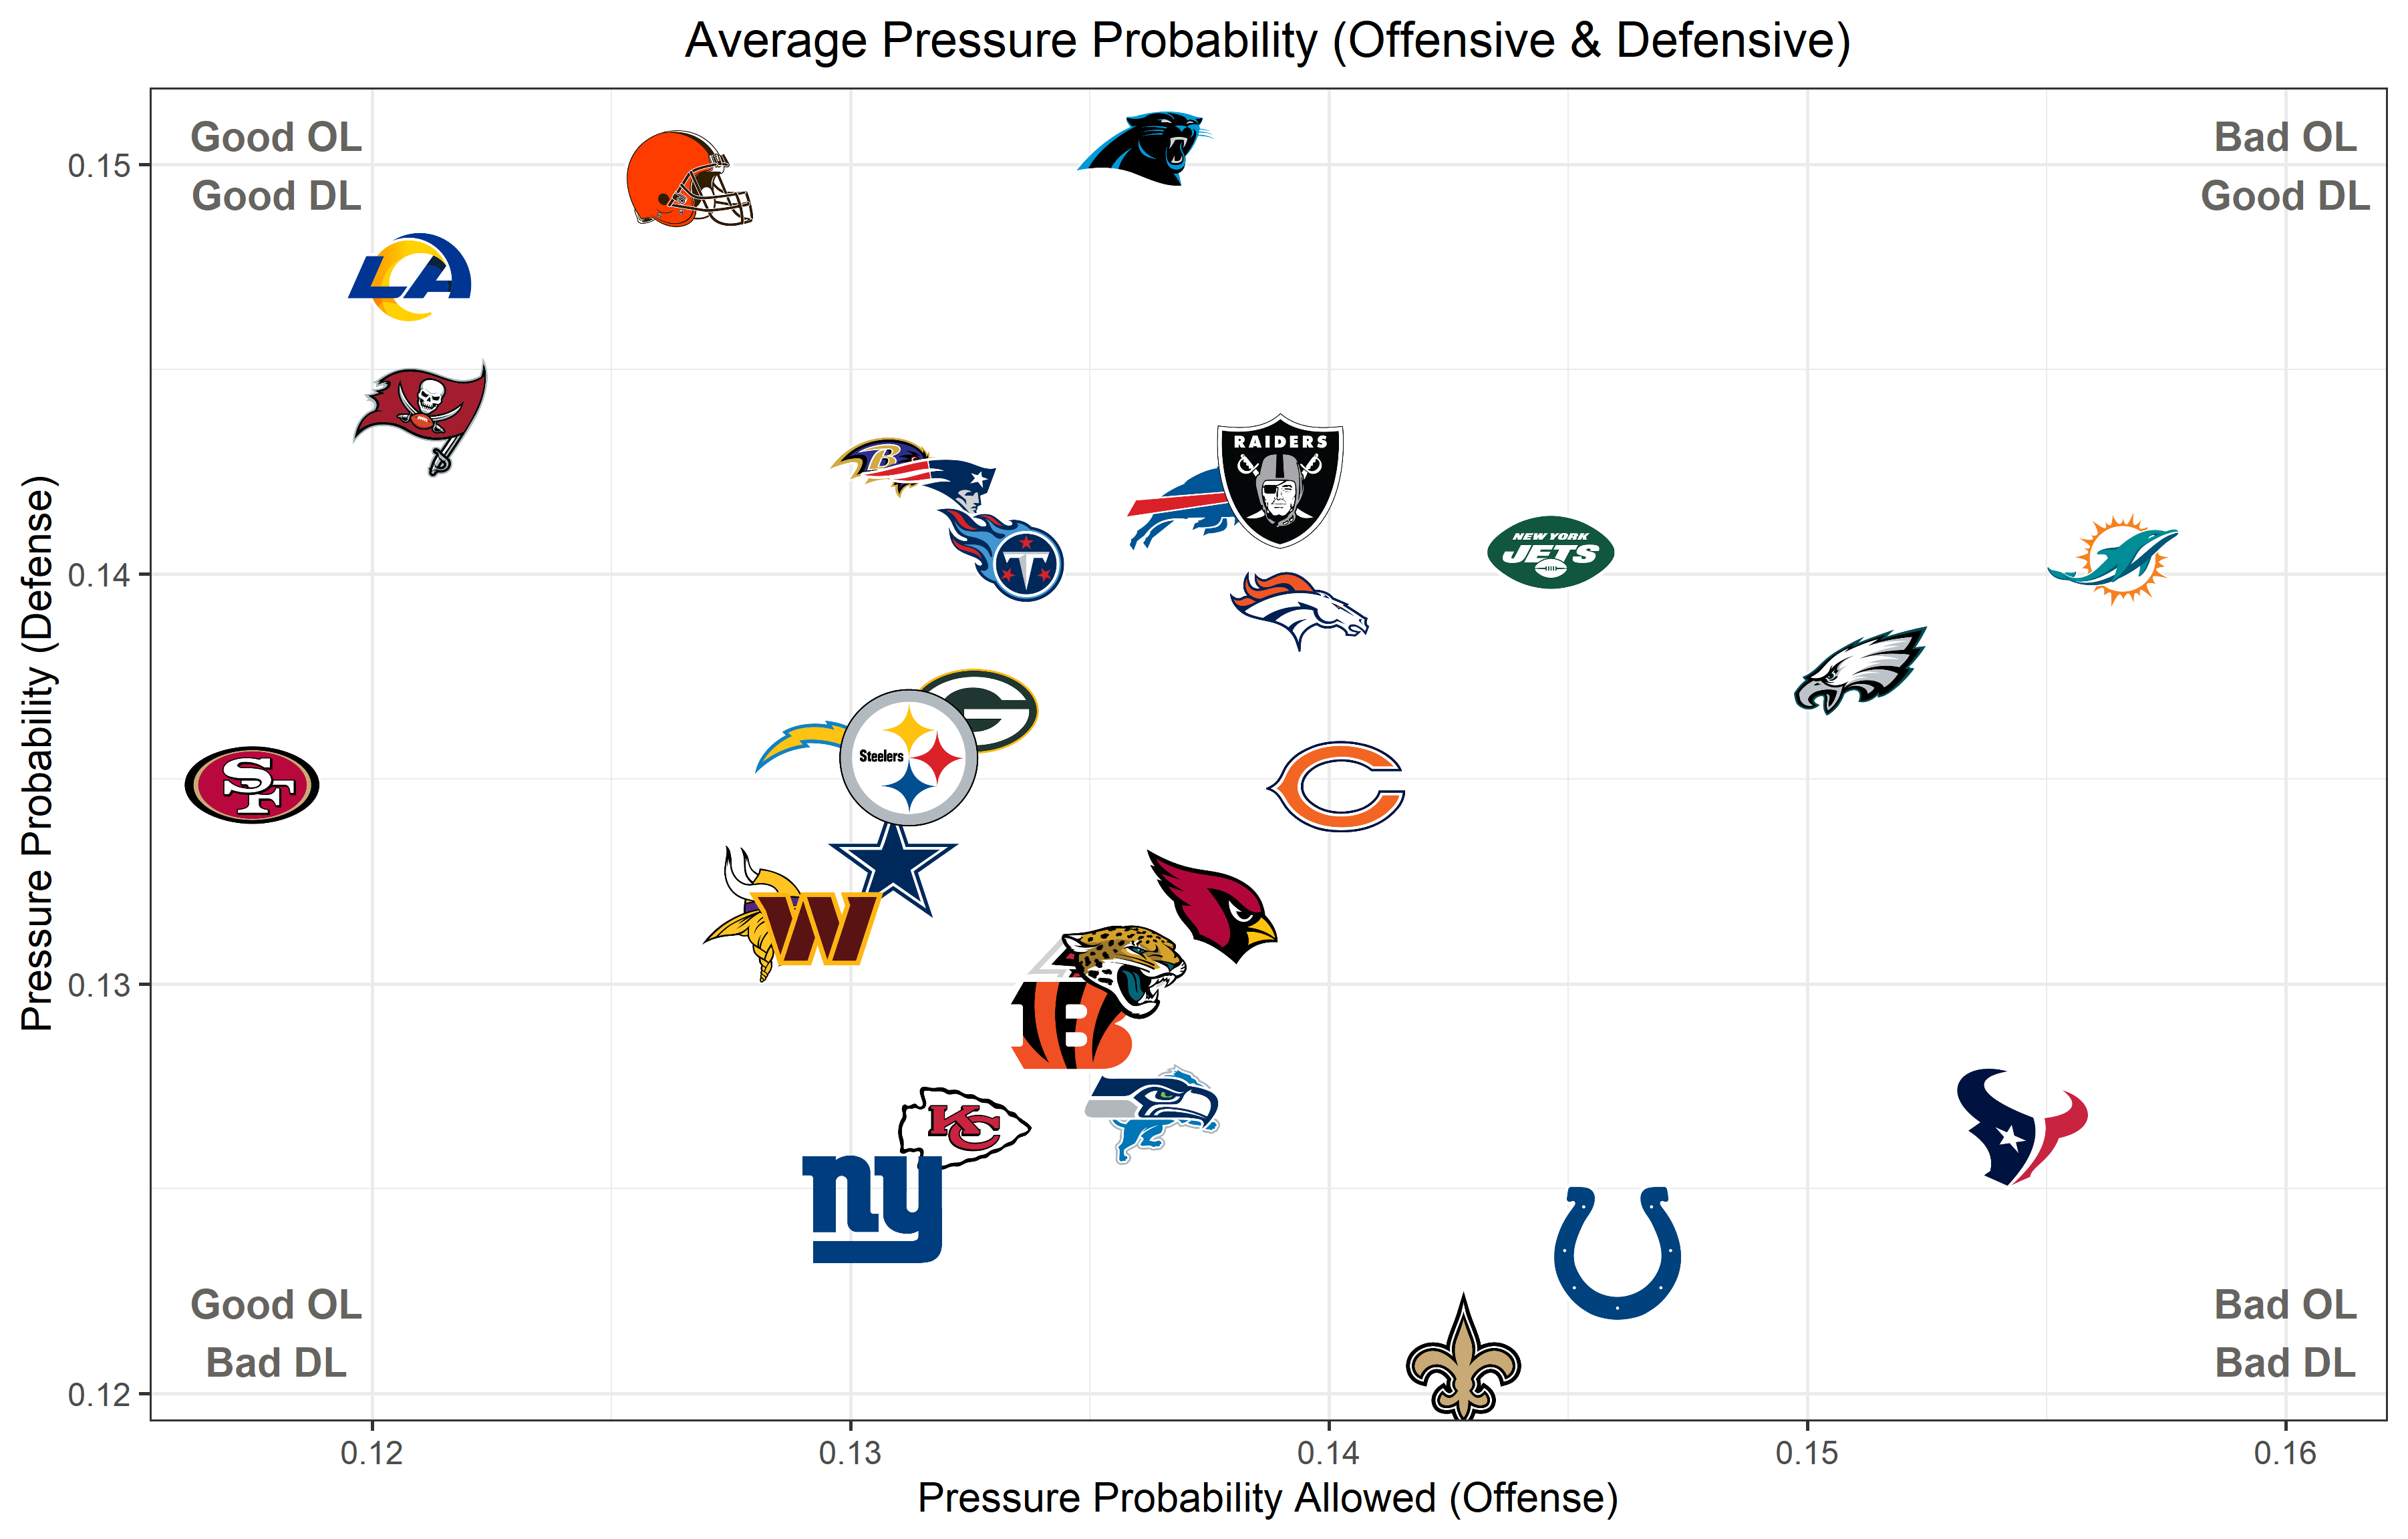
Most of the results here align with what we may expect - for instance, the eventual Super Bowl winning Los Angeles Rams enjoyed great offensive tackle play from Andrew Whitworth and Rob Havenstein while also boasting the best defensive player in the game with Aaron Donald in the trenches.
WATT: Weighted Average of Threat Tension
Background
The first idea one may have to form a metric from the model’s output is to simply calculate the mean pressure probability for a pass rusher over all of their frames. There’s a fundamental problem with that approach, though. As the prior visualizations showed, the average pressure probability for a player is not constant across all frames. Furthermore, we would not expect all pass rushers to have equal distribution of frames played - if a pass rusher plays with a poor secondary, they’re probably going to have fewer plays where they have five seconds to get to the quarterback. Thus, taking an unweighted average introduces a bias based on factors out of a pass rusher’s control. The entire purpose of this competition is for isolated linemen evaluation.
Also, a player’s position is a variable that would influence any analysis. Edge rushers are more likely to record a pressure than interior linemen.
While we could separate by official position when ranking players, this approach opens up another bag of worms. Aaron Donald is officially listed as a defensive tackle but played on the outside on 80% of his pass rush snaps in the first half of the 2021 season. The same was true for Chris Jones. When versatile players are placed into different roles, it becomes necessary to account for this variable in a holistic analysis.
Methodology
My solution for accounting for these variables is straightforward. First of all, I train a regression model that estimates the expected pressure probability for every pass rush frame based on two independent variables: the position that the pass rusher lined up in according to Pro Football Focus, and the index of that frame (whether it was the 1st, 7th, or 12th frame in that play, for example). This simple model provides a baseline pressure probability for every observation based on how deep into the play it occurred and what position the pass rusher plays. Then, I subtract the predicted pressure probability from the actual pressure probability for each player.
The “over expectation” pressure probability value is a representation of how a player’s position compares to what might be expected based on their position and how much time has passed in the play. A blitzing cornerback is expected to impose an immediate threat to the quarterback sooner than a nose tackle is - the model accounts for this fact.
Finally, I calculate the weighted average of each player’s pressure probability over expectation. The weight used is the proportion of total plays that last as long as the play in question (at the frame in question). For instance, about 21% of plays in the data set consisted of at least 40 frames (i.e. they lasted at least four seconds). Thus, observations at frame 40 would be given weight 0.21. The purpose of this adjustment is to weigh more frequent frames higher because players who excel at those points in a play will have more opportunities to provide value.
The final value is called Weighted Average Threat Tension (WATT).
Results
The top 20 pass rushers and blockers by WATT are shown below.
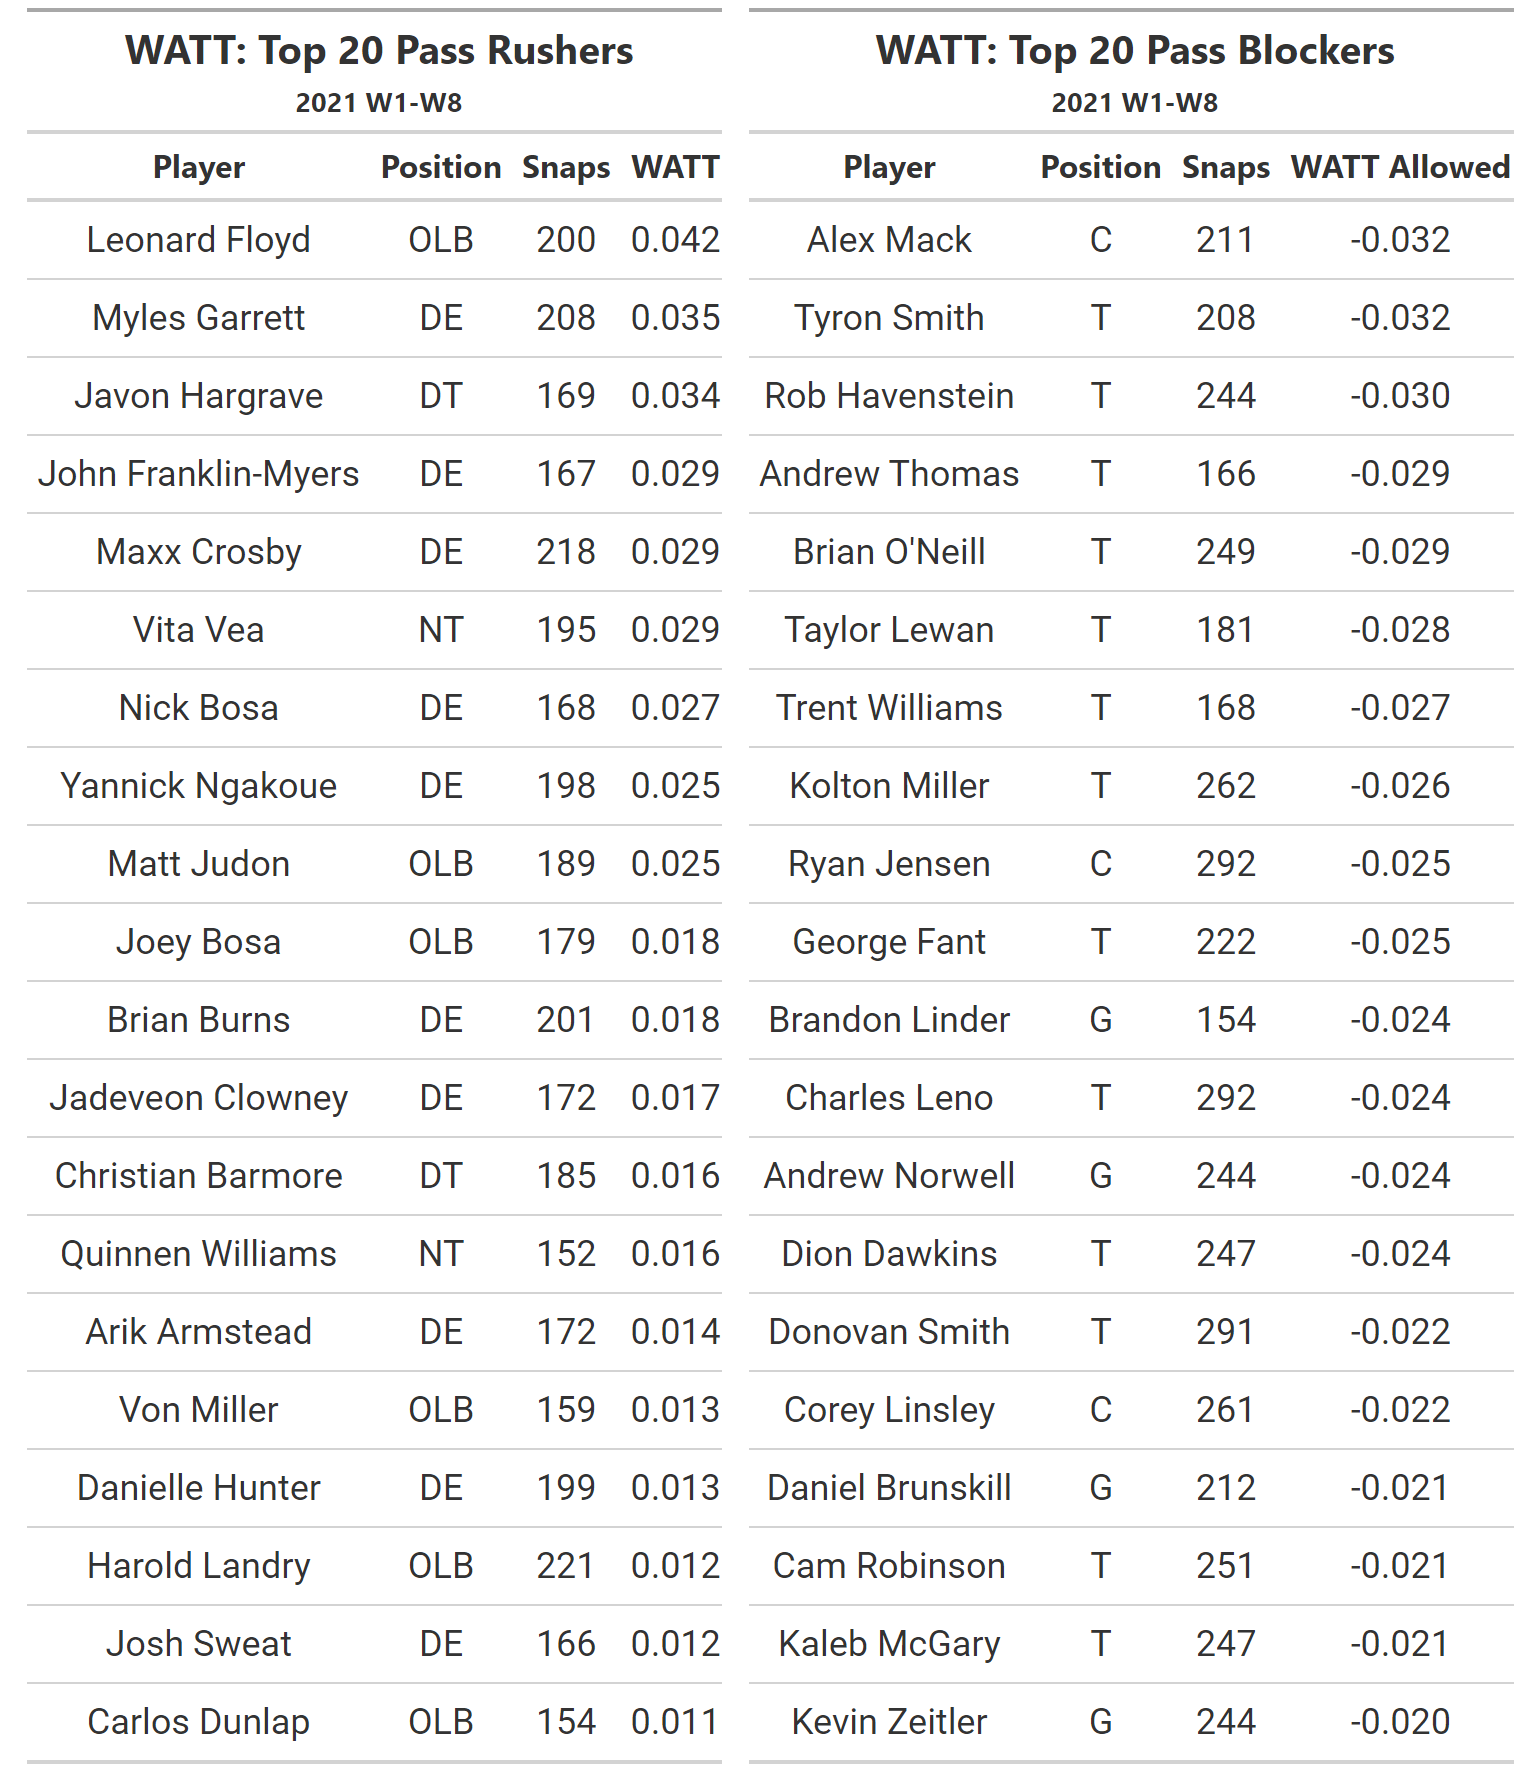
Many of the names above are ones that one may expect to see on such a ranking. Even some of the less expected appearances are not surprising following further inspection. For instance, Javon Hargrave is not a household name, but his PFF pass rush grade of 91.6 was second among all interior defenders.
What may be more surprising is some of the names that are missing. The omissions include the likes of All-Pro defenders T.J. Watt and Aaron Donald. I hypothesize that the sheer defensive attention that someone like Aaron Donald faces results in lower pressure probabilities, and Leonard Floyd’s #1 ranking may be influenced by Donald’s greatness.
Conclusion
I found that that a convolutional neural network based on relative location and speed features performed well for the task of estimating the probability that a pass rusher will record a pressure. I proceeded to utilize the model for player and team evaluation, where its value as a metric was further revealed.
However, further work can be done to improve and build upon this analysis. The information provided by pressure probability is incomplete - the numbers shown here, for example, might mislead some into thinking that Leonard Floyd is a more important pass rusher for the Los Angeles Rams than Aaron Donald. It is important to qualify what exactly this analysis is quantifying, and that is the strength of individual positions. How dangerous is the position that this edge rusher achieved 1.5 seconds into this play? Its purpose does not include a consideration for whether that edge rusher actually finished the play and recorded a pressure.
In any case, I believe it is a strong start and can be a valuable tool for evaluating pass rush and pass block effectiveness.