Django Application for Video Game Statistics
On this page, I provide background information on the project idea and my motivations, along with a description of the process to complete the project. You can find a link to the completed product here and the GitHub repository here.
In short, I developed a Django application to serve as a dashboard for Valorant statistics. I leveraged Selenium WebDriver to scrape data from the web into a SQLite database. Additionally, Matplotlib, D3.js, and Chart.js were all used for visualization.
Background
Valorant is a competitive tactical first person-shooter developed by Riot Games. A single match in Valorant is played by two teams of five players and consists of up to 24 rounds, with teams alternating between attack and defense after 12 rounds. The first team to win 13 rounds is declared the winner (overtime is played if necessary). The broad goal for most players is to increase their rank - games are played between teams of similar rank, and winning/losing a match increases/decreases a player’s rank rating.
My friends and I frequently play(ed) Valorant competitively with pre-made parties of five players. In other words, five friends would enter a game together on the same team and be matched up against a similarly ranked group of five friends.
My goal with this project was to create a website similar to Sports Reference sites (think basketball-reference.com, pro-football-reference.com) but for our Valorant matches. I envisioned having pages for individual matches and players, various analysis tools, aggregated and filterable statistics, etc. I wanted to create a practical product that could actually be used by our team to identify strengths and weaknesses. I also thought that this would be a bit more unique than re-creating some NBA or NFL project that’s been done countless times prior.
Methodology
The first step in this project was to find a way to collect the data. The obvious solution would be to use the Riot Games API, but they do not provide API keys for personal projects. Thus, I turned to Tracker Network, a site that uses the Riot Games API and serves as a public product for Valorant statistics. Tracker features individual detailed pages for each individual match played, including match-level information (date, map, score, etc) and player-level information (individual performance).
Next, I set up the Django project that would host this application. This step required establishing the Django models.py file (essentially initializing the data schema) before I could collect any data. I initially created two main models: Match, representing an individual match played, and Player, representing a single person’s performance in a single match. Thus, the Player model has a Match field.
I wrote a script using Selenium WebDriver to scrape a match’s data from Tracker Network given a match ID (or multiple). For each match, the script updated the Match model with one additional object and the Player model with ten additional objects (representing the ten players in a match).
SQLite was used as the backend database for this project. To this day, it consists of 540 Match objects and 5400 Player objects.
Everything that came after was just creating the various pages of the website and processing the raw database as necessary.
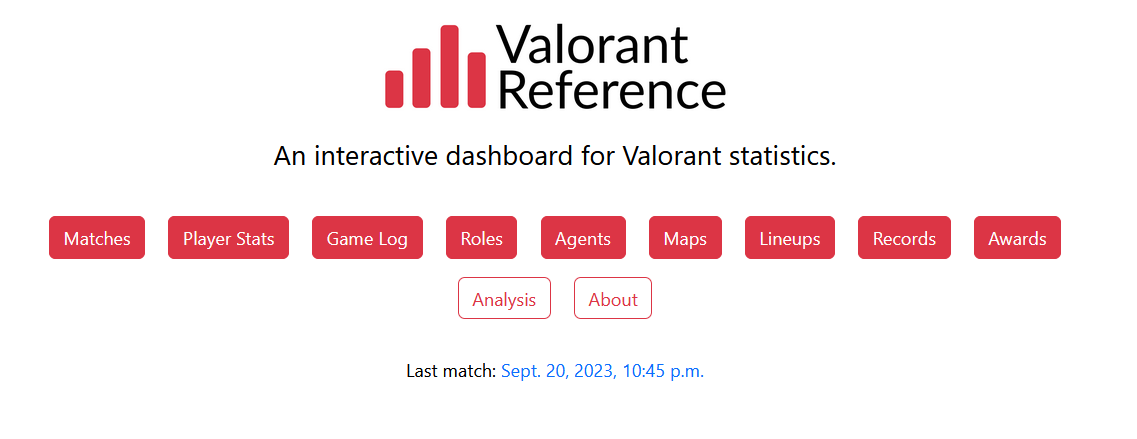
Results
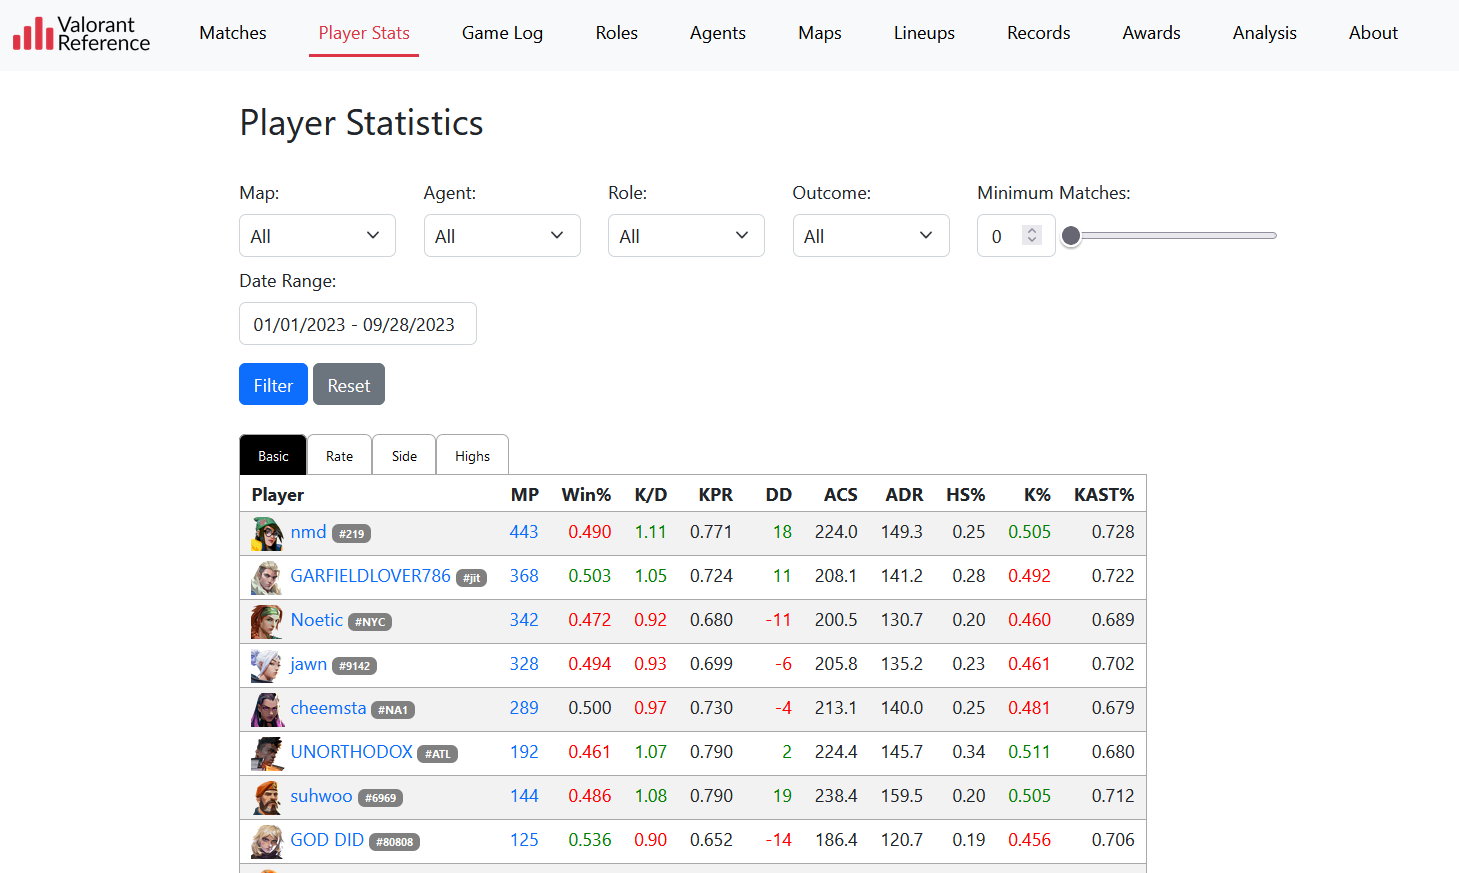
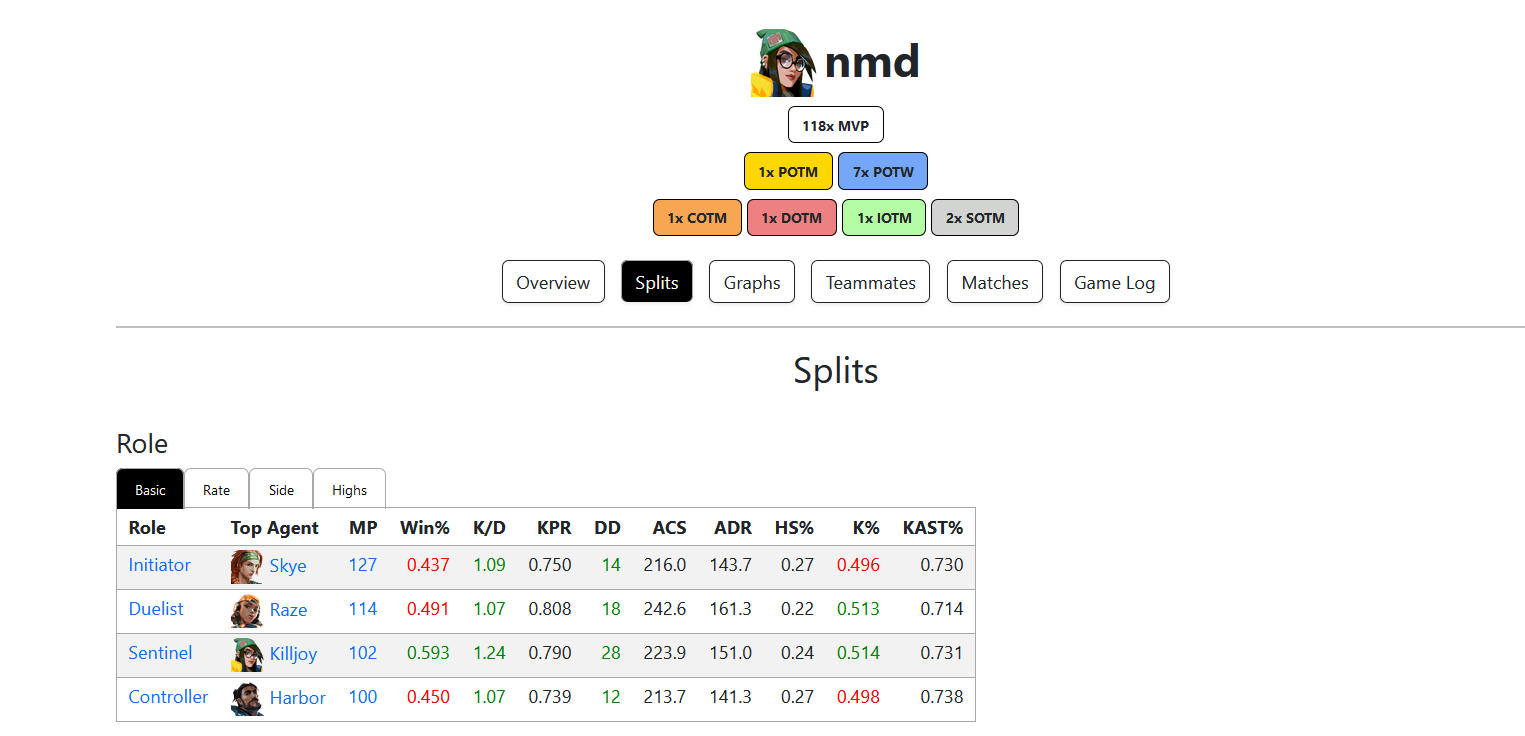
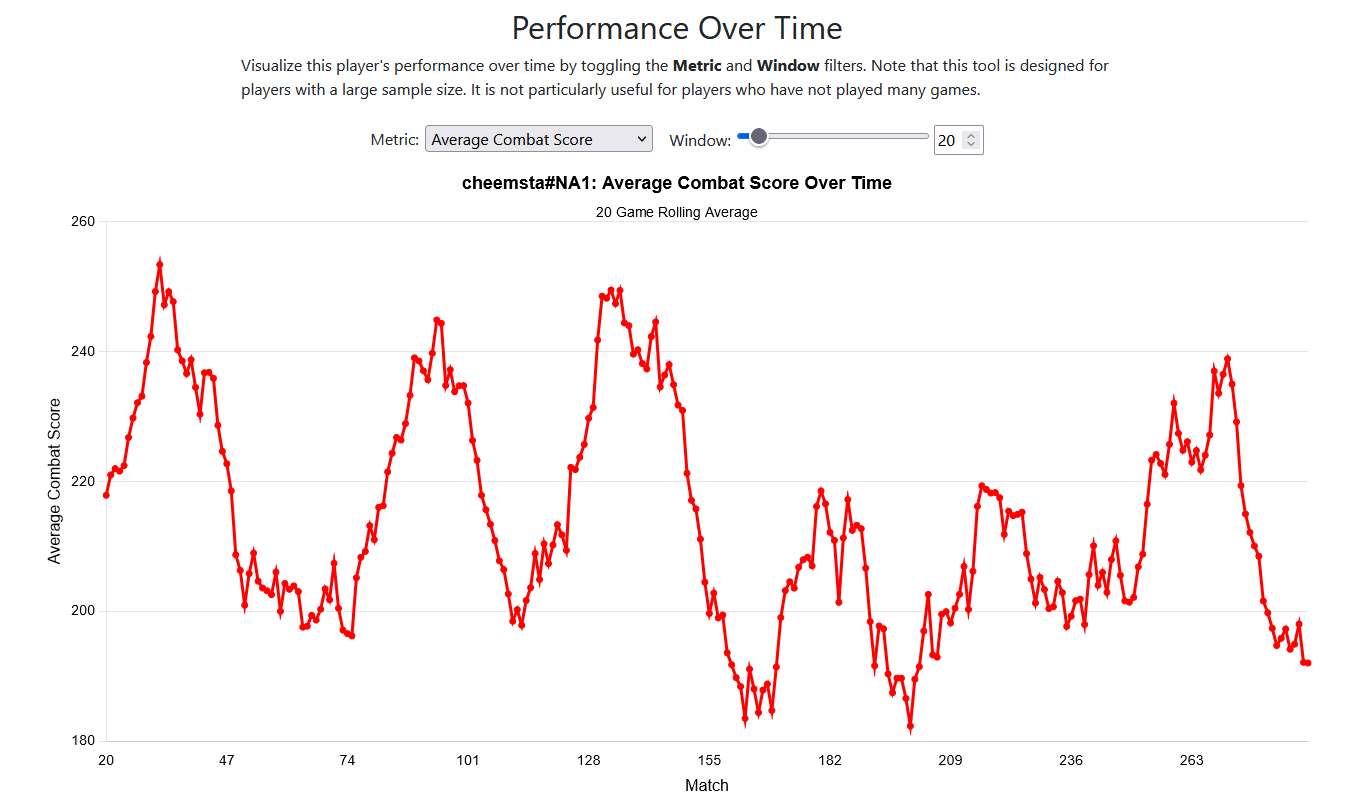
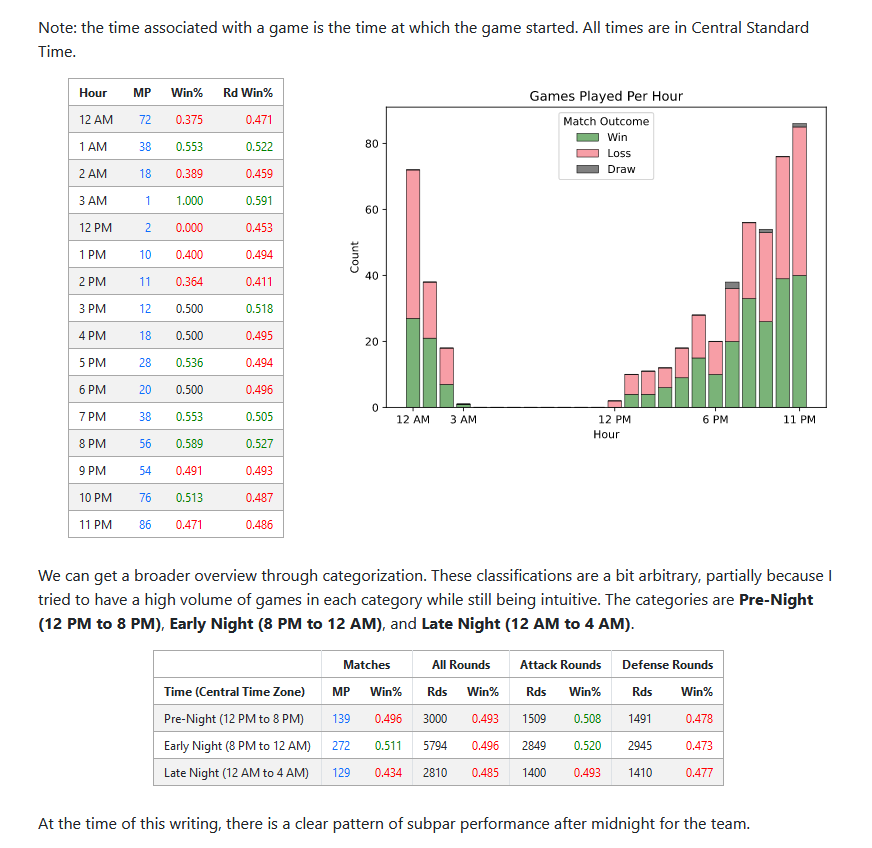
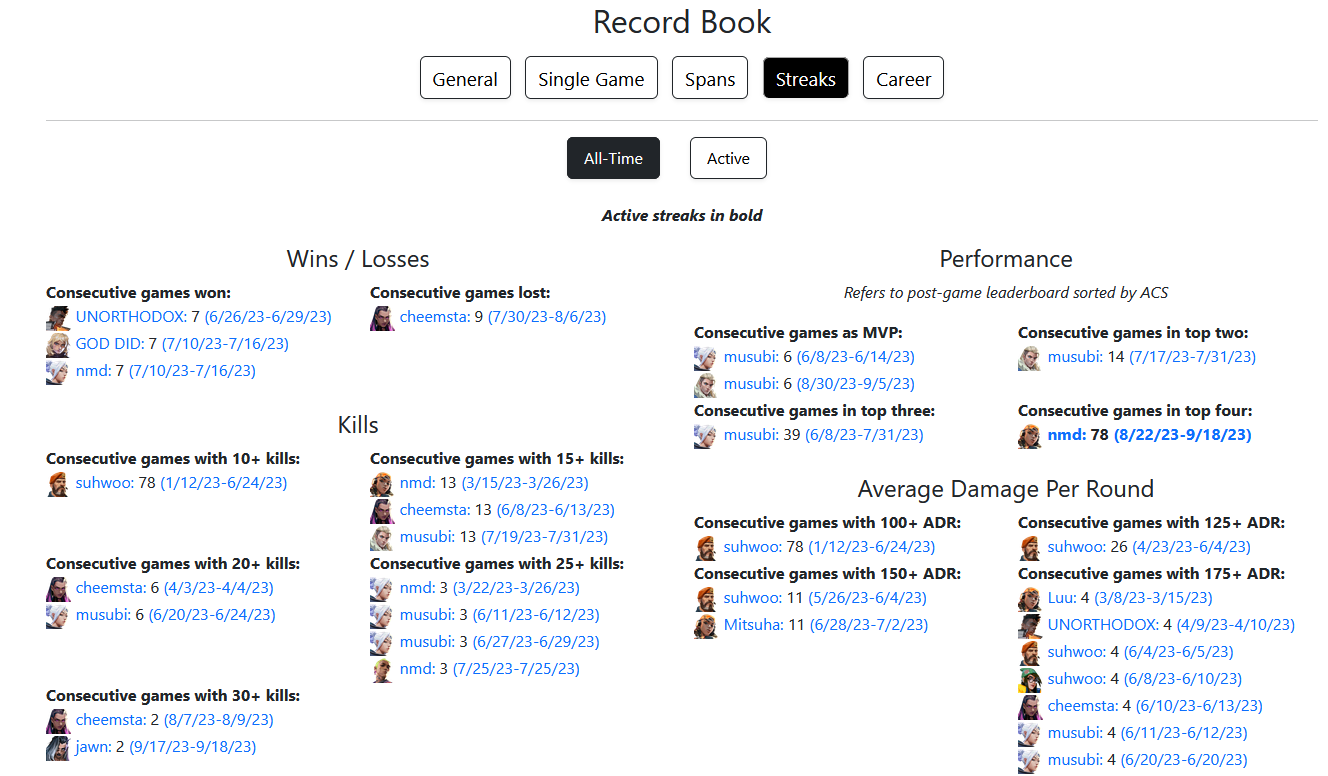
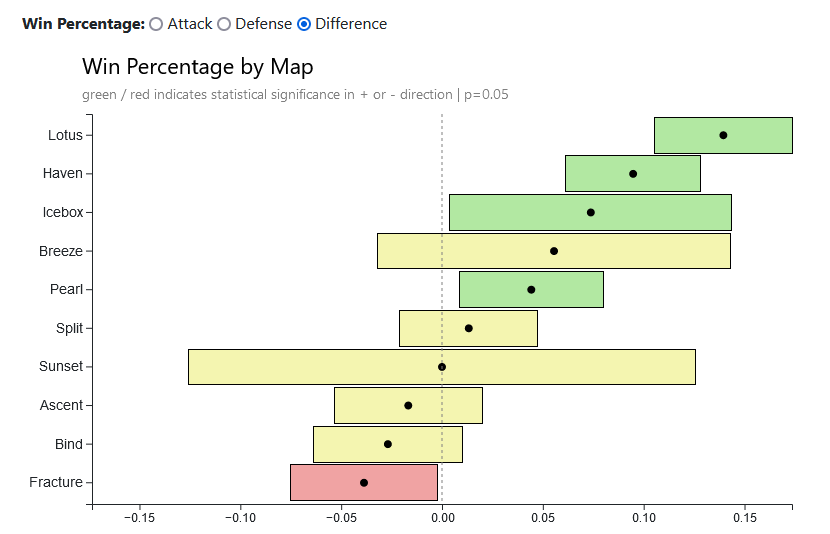
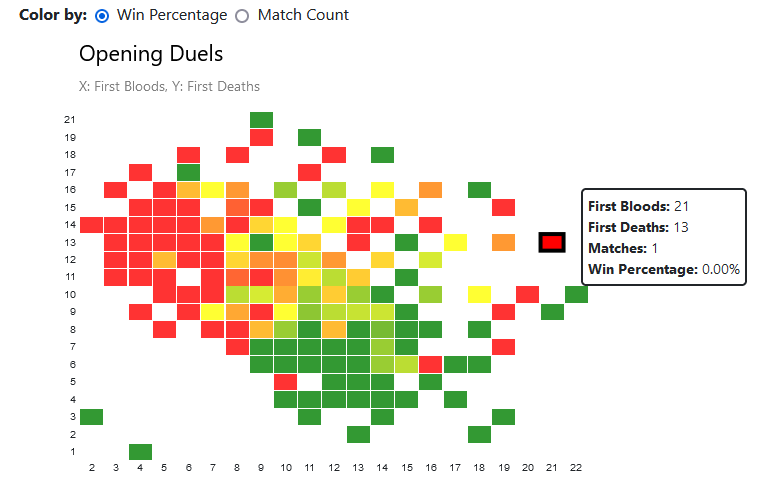
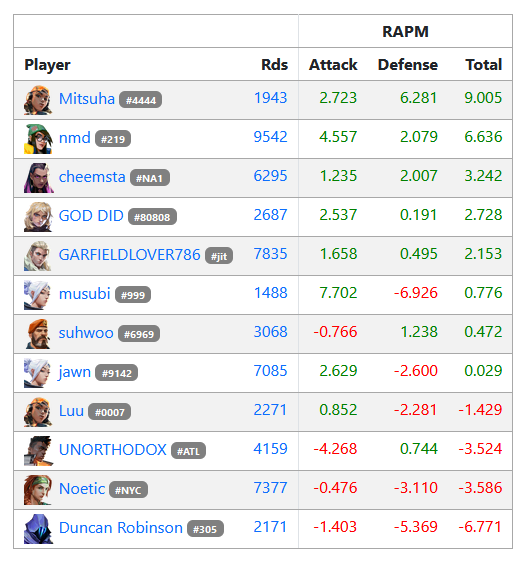
Here’s a quick run through of some of the pages on the site. Each image contains a hyperlink to the corresponding page on the website. Of course, there’s plenty more content on the site itself.